Patient Experience Survey Summary Report
Conducted September 2019
Introduction
For a three week period starting on 3rd September, a survey was conducted in relation to patient experiences within the hospital. A questionnaire was distributed to women on the prenatal, postnatal or gynaecology wards and they were asked to complete it prior to discharge. 275 questionnaires were returned. There were 792 women discharged during that timeframe. Of the 275 respondents, 72.5% were attending as public patients, 15.8% private and 11.7% semi-private.
Results
Responses from the women participating in this survey were in the main very positive. Some of the many positive aspects include when asked if, overall, the patients were satisfied with the service they received, 98.9% ticked the box for ‘Yes’. When invited to indicate whether they agreed or disagreed with the statement “I had confidence in the staff providing my care”, 99.3% chose either the ‘Strongly agree’ or ‘Agree’ options. For the statement “The information given by members of my healthcare team was easy to understand”, 98.5% chose ‘Strongly agree’ or ‘Agree’, with the figure being 99.3% for “I was always treated with dignity and respect”; 99.2% for “I trusted the members of my healthcare team” and 99.3% for “I would recommend this hospital to a friend or family member”.
The respondents were asked to rate the Hospital facilities under five headings with five multiple-choice options available – ‘Very good’, ‘Good’, ‘Poor’, ‘Very poor’ and ‘Not relevant’. The rating for adequacy of public toilets showed a small change compared to the last survey, as the percentage rating this facility as ‘poor’ or ‘very poor’ has decreased from 11.0% to 7.7%. In addition, 100% of patients indicated that the overall cleanliness of the hospital was ‘Good’ or ‘Very good’. The issue of inadequate parking facilities was highlighted once again – see Table 1.
Table 1
| Very good | Good | Poor | Very poor | Not relevant | |
| Contacting hospital by phone | 46.5% | 38.4% | 5.9% | 2.2% | 7.0% |
| Availability of parking facilities | 18.2% | 36.0% | 26.9% | 8.7% | 10.2% |
| Adequacy of public toilets | 38.8% | 50.5% | 7.0% | 0.7% | 2.9% |
| Ease of finding way (signage) | 47.4% | 47.8% | 4.0% | 0.0% | 0.7% |
| Overall cleanliness of hospital | 71.3% | 28.7% | 0.0% | 0.0% | 0.0% |
In relation to the meals the patients received, the questionnaire enquired as to whether they had been asked if they had any special dietary requirements. 63.4% responded ‘Yes’, 25.0% ‘No’ and 11.6% indicated that they ‘Can’t remember’. When asked if they were satisfied with the meals they received, 89.9% indicated ‘Yes, always’ [up notably from 81.7%]; 9.3% ‘Yes, sometimes’ [down from 17.9%] and 0.7% ‘No’ [previously 0.4%].
When asked to indicate their level of agreement with the statement “The food I received was of a high quality”, the percentage that either ‘strongly agreed’ or ‘agreed’ was 97.4%, up from 95.4% in the previous survey.
Comments and Suggestions
The final question on the survey consisted of a section in which respondents were asked to provide comments relating to their recent experience of The Rotunda Hospital or make suggestions on how the hospital could improve the services it provides. These comments were split into categories depending on the nature of the remark. There were 61 positive comments regarding the staff, care and services provided in the Rotunda. There were 39 comments identifying areas for improvement: 2 relating to communication and information; 21 regarding facilities, accommodation and food; 5 pertaining to staff attitude and manner; 9 concerning safe and effective care and 2 in connection with privacy, dignity and respect.
Areas for Action
The draft report was reviewed by the Quality and Safety Committee on 24th October 2019 and the following areas were identified for priority action:
- The content for a video containing information for women on discharge from hospital following birth has been collated and recorded. This video is to be edited and finalised prior to uploading onto the website and app.
- Commence the roll out of the National Healthcare Communication Programme to improve communication with patients and families.
- Install toilet seat sanitizers in all toilet facilities.
- Review the type of sanitary bins provided.
Conclusion
Overall, the responses are very similar to previous survey findings. Chart 1 shows the trend of the percentage of respondents indicating a rating of ‘Very good’ for overall hospital cleanliness over previous surveys, with the nine new ‘patient experience survey’ values marked in red. This shows an increase of 6.3 percentage points since the last patient survey carried out in June 2018.
Chart 1

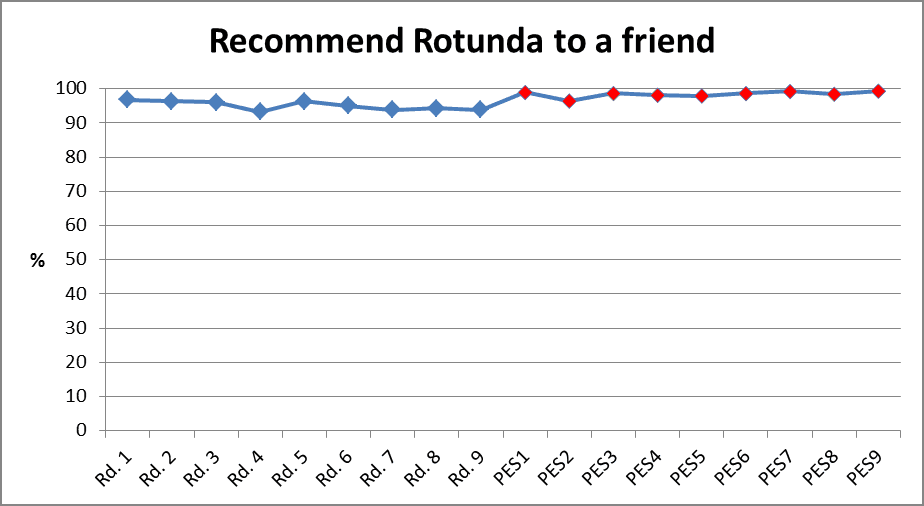
An important measure is the number of patients that would recommend the Rotunda Hospital to a friend, and any trends in this variable are worthy of note. The question asked in the initial nine patient satisfaction surveys was “Would you recommend the Rotunda Hospital to a friend?” with the two options of ‘Yes’ and ‘No’. The patient experience survey asks patients to indicate their agreement or otherwise with the statement “I would recommend the Rotunda Hospital to a friend or family member. Combining the figures for the ‘Strongly agree’ and ‘Agree’ options yields a figure of 99.3% and along with the previous PES results, is highlighted in red in Chart 2.
Chart 2
You can see the results of the 2018 Patient Experience Survey Here