Patient Experience Survey Summary Report
Conducted June/July 2018
Introduction
For a three week period starting on 27th June, a survey was conducted in relation to patient experiences within the hospital. A questionnaire was distributed to women on admission to the prenatal, postnatal or gynaecology wards and the women were asked to complete it prior to discharge. 267 questionnaires were returned. There were 747 women discharged during that timeframe. Of the 267 respondents, 69.1% were attending as public patients, 17.7% private and 13.2% semi-private.
Results
Responses from the women participating in this survey were in the main very positive. Some of the many positive aspects include when asked if, overall, the patients were satisfied with the service they received, 98.5% ticked the box for ‘Yes’. When invited to indicate whether they agreed or disagreed with the statement “I had confidence in the staff providing my care”, 98.5% chose either the ‘Strongly agree’ or ‘Agree’ options. For the statement “The information given by members of my healthcare team was easy to understand”, 98.5% chose ‘Strongly agree’ or ‘Agree’, with the figure being 97.7% for “I was always treated with dignity and respect”; 98.5% for “I trusted the members of my healthcare team” and 98.4% for “I would recommend this hospital to a friend or family member”.
The respondents were asked to rate the Hospital facilities under five headings with five multiple-choice options available – ‘Very good’, ‘Good’, ‘Poor’, ‘Very poor’ and ‘Not relevant’. The rating for adequacy of public toilets showed a small change compared to the last survey, as the percentage rating this facility as ‘poor’ or ‘very poor’ has increased from 6.5% to 11.0%. In addition, 99.6% of patients indicated that the overall cleanliness of the hospital was ‘Good’ or ‘Very good’. The issue of inadequate parking facilities was highlighted once again – see Table 1.
Table 1
| Very good | Good | Poor | Very poor | Not relevant | |
| Contacting hospital by phone | 39.9% | 39.8% | 9.1% | 1.9% | 10.2% |
| Availability of parking facilities | 17.0% | 36.3% | 26.3% | 10.0% | 10.4% |
| Adequacy of public toilets | 31.6% | 54.4% | 9.5% | 1.5% | 3.0% |
| Ease of finding way (signage) | 45.9% | 50.8% | 3.0% | 0.0% | 0.4% |
| Overall cleanliness of hospital | 65.0% | 34.6% | 0.4% | 0.0% | 0.0% |
In relation to the meals the patients received, the questionnaire enquired as to whether they had been asked if they had any special dietary requirements. 59.3% responded ‘Yes’, 30.4% ‘No’ and 10.3% indicated that they ‘Can’t remember’. When asked if they were satisfied with the meals they received, 81.7% indicated ‘Yes, always’ [down slightly from 82.7%]; 17.9% ‘Yes, sometimes’ [up from 15.7%] and 0.4% ‘No’ [previously 1.6%].
When asked to indicate their level of agreement with the statement “The food I received was of a high quality”, the percentage that either ‘strongly agreed’ or ‘agreed’ was 95.4%, up from 91.4% in the previous survey.
Comments and Suggestions
The final question on the survey consisted of a section in which respondents were asked to provide comments relating to their recent experience of The Rotunda Hospital or make suggestions on how the hospital could improve the services it provides. These comments were split into categories depending on the nature of the remark. There were 70 positive comments regarding the staff, care and services provided in the Rotunda. There were 44 comments identifying areas for improvement: 2 relating to communication and information; 20 regarding facilities, accommodation and food; 7 pertaining to staff attitude and manner; 11 concerning safe and effective care and 4 in connection with privacy, dignity and respect.
Areas for Action
The draft report was reviewed by the Quality and Safety Committee on the 20th September 2018 and the following areas were identified for priority action:
1 Implement the proposed call centre for appointments scheduling, which will improve phone access, facilitate automated messages, call recording and direct messaging of patients and staff on their mobile phones.
2 Implement the campus wide way-finding system, which is in compliance with requirements under the Official Languages Act.
3 Pilot patient management of postnatal analgesia where appropriate.
4 Provide more timely catering options to gynae patients post-operatively by implementing the plan agreed between Midwifery/Nursing and the Catering Department.
5 On-going recruitment of midwifery and nursing staff to meet existing and future staffing requirements.
Conclusion
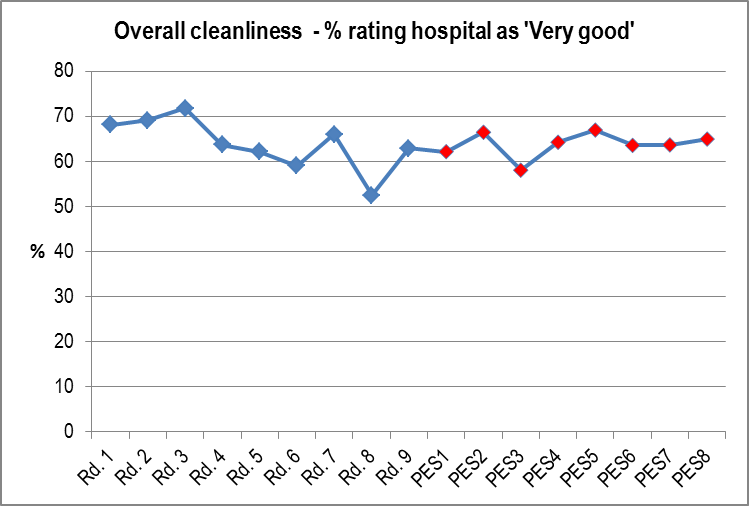
Overall, the responses are very similar to previous survey findings. Chart 1 shows the trend of the percentage of respondents indicating a rating of ‘Very good’ for overall hospital cleanliness over previous surveys, with the seven new ‘patient experience survey’ values marked in red. This shows a little change since the last patient survey carried out in June 2017.
Chart 1
An important measure is the number of patients that would recommend the Rotunda Hospital to a friend, and any trends in this variable are worthy of note. The question asked in the initial nine patient satisfaction surveys was “Would you recommend the Rotunda Hospital to a friend?” with the two options of ‘Yes’ and ‘No’. The patient experience survey asks patients to indicate their agreement or otherwise with the statement “I would recommend the Rotunda Hospital to a friend or family member. Combining the figures for the ‘Strongly agree’ and ‘Agree’ options yields a figure of 98.4% and along with the previous PES results, is highlighted in red in Chart 2.
Chart 2

You can see the results of the 2017 Patient Experience Survey here.
The next survey is scheduled for summer 2019.